


Performance fees for investment products are often criticized and perceived as not fair by investors. The structure of performance fees can be a reason for potential investors to shy away from a manager. There is a way to design performance fees to better align interests of investors and managers by including risk into the definition of performance. We show a simple model that prevents managers from increasing risk at the expense of their investors.
In situations with classical principal-agent problems an alignment of interests is a good idea. When the principal (investor) has no chance to monitor the behavior of his agent (manager) or it would be very expensive, a performance-related metric can help align the interests of both parties. This idea is behind the well-known performance fees of hedge funds. The concept is also spreading more and more to vehicles open for retail investors. Beside the fixed management fee that ensures solid income to finance operations, the manager usually receives a share of the returns to get compensated for his skill. This skill might be measured in terms of absolute returns, relative returns compared to a benchmark or against any other investment goal determined upfront.
Option Characteristics
Performance fees share major characteristics with call options. The manager participates when the investment strategy (or just the market) goes up, it expires (often performance is measured on an annual basis) and last but not least, the big determinant of the current value of the performance fee is volatility. The more volatile the investment strategy is, the higher the probability of a positive payoff, ceteris paribus. The maximum loss for the manager is the premium he bought the option for which was essentially zero in monetary terms. The big difference is that the investment manager can directly influence the value of his performance fee option by delivering good returns but also by increasing volatility.
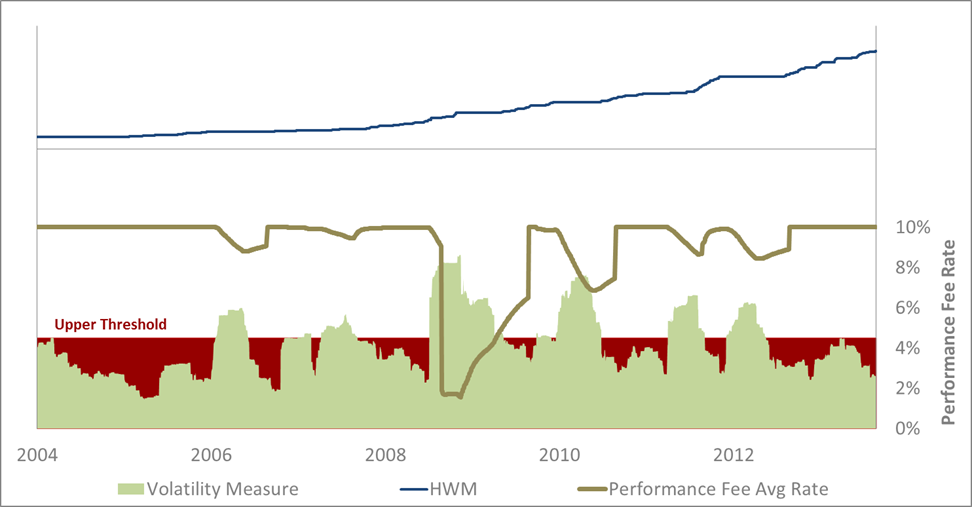
Chart:Annual average performance fee rate depending on a volatility measure
It is not always apparent if the strategy, the manager follows thoroughly, just moved to higher volatility levels or if the manager shifted his style, increased leverage or added high beta positions to the portfolio. Some indication might come from historical volatility of the strategy or by comparing the characteristics of current portfolio components with historic ones. Still, it is difficult to assign an increase in the volatility of the portfolio to an activity of the manager or a passive market development. Intentionally, for the suggested concept we exclude option and short volatility strategies which can deliver good returns with low volatility over several years but essentially the manager might just be picking up pennies in front of a steamroller.
A simple Concept to include Risk
One can argue that volatility is not a perfect proxy for risk. We agree, because some volatility is required to achieve returns from risky assets and volatility without context does not tell much about the risk exposure of a portfolio. Therefore, in our model we set a band for a downside volatility measure with the lower limit at zero and the upper limit determined by the manager and/or the investor upfront. The upper limit can be a volatility level that the investor just accepts, a level the manager realistically can stay below or a historical average for the strategy. As long as realized volatility stays below that threshold, the full performance fee rate is assigned. For realized volatility that is above the upper limit, the performance fee rate decreases to zero either asymptotically or at another higher threshold. A daily rolling calculation leads to an average performance fee rate over a year. This average is applied to calculate the performance fee for one year. Even in a year with high returns, certainly above any high watermark or other benchmark, the manager might not receive the full performance fee rate when his portfolio entered territory above the upper volatility band during the year. At first glance, the manager could consider it unfair that he is penalized in years with extraordinarily high returns which are often accompanied by higher volatility. Although it is true that his payout in percentage points is lower than in the ordinary model without risk adjustment, he collects the performance fees on a higher volume and another offset comes from management fees that are also based on a higher volume. Not a bad deal for both parties.
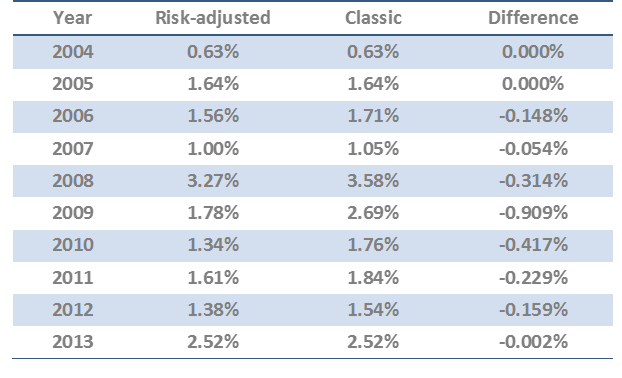
Table: Comparing the payout in terms of percentage points on assets under management between the risk-adjusted model and the classic performance fee model with 10% participation on returns over a high watermark.
Applied to Multi Asset and Market Timing Strategies
The model introduced can be applied to multi asset strategies and balanced portfolio strategies where it shows its real strengths. When shifting between asset classes the model automatically adjusts. Increasing the weight of a more conservative asset class (i.e. US treasuries) should lead to lower portfolio volatility, but with also lower return expectations it becomes harder for the manager to reach the high watermark or to outperform the benchmark. The same automatic adjustment works for a market timing strategy. When decreasing market exposure or leaving the market completely (moving into cash positions), the volatility measure decreases up to a minimum of zero. The manager would be assigned the full performance fee rate but on the other hand has no chance to cross above the high watermark. Even in case the managers return is compared to a benchmark (relative returns), applying the risk-adjusted model here might be reasonable. Either the benchmark exhibits a positive return, so that the manager will not receive any performance fee or if the benchmark’s return is negative the manager will receive performance fees for his skill to time the market correctly.
The chart shows a high watermark for a hypothetical portfolio. The portfolio consists of multiple strategies on global equity markets and also has a market timing component. The maximum performance fee rate the manager can achieve is 10%. In the lower part of the chart, a volatility measure (green area) determines the average performance fee rate. For realized volatility below the upper threshold, the full rate is assigned, while for volatility above the threshold the performance fee rate decreases linearly to zero for volatility that has twice the magnitude. The effects become clear in the table. Implementing the risk-adjusted performance fee model leads to lower payouts to the manager in percentage terms in eight out of ten years. The difference in payout is 28 basis points on average.
Conclusion
Adjusting the performance fee rate by a risk measure penalizes a manager for increasing the risk in the portfolio and therefore gives investors a valuable tool to keep their managers in check. Volatility is not a perfect risk measure and it is not easy to distinguish the sources of increased volatility in a portfolio. However, we implemented volatility in the model because any risk metric adds value compared to the classic performance fee approach. Volatility can be replaced by any metric that serves as a proxy for risk. A good substitute for volatility is the ulcer index, which aggregates the magnitude and frequency of drawdowns into a single number and therefore indicates the pain felt by the investor. .